Received 1 May 1996
Revised 1 July 1996
Timelines represent a familiar means for representing the relationship among historical events. When incorporated into the context of electronic documents, the timeline provides the basis for implementing an interface into an event space, relying particularly on hypertextual-style links. Generalizing timelines also permits the flexible representation of many different kinds of relationships beyond the temporal. This paper includes examples of such representations, showing examples from prototype implementations.
Keywords
timelines, interactive documents, document-based interfaces,
digital libraries, hypertext/hypermedia,
information visualization
The key characteristics of documents are that they present selected information
and they structure that information to be comprehended readily. Documents are
written by an author for a purpose---presumably to communicate some set of
concepts to a reader. Inherent with the concept of communication is the concept
of structure. Documents long have been used to organize diverse material
related to common themes. They provide a powerful metaphor which can be used to
organize temporal, spatial, relational, and even unrelated data. In the digital
world, interactive documents potentially are useful as interfaces for digital
libraries and large, complex on-line systems [1] . Specifically, a
document interface can provide context, encapsulation, and links to related
information.
In an interactive environment, the opportunity exists to define new forms of
documents---documents that aid in the organization of information, in the
presentation of relationships among information elements, and in the flexible
reformulation of structure to highlight different aspects of the information
space. For instance, Allen [2] has demonstrated how an interface may
be applied to digitized videotapes, effectively making them interactive
documents.
In this paper, we explore the use of interactive documents as interfaces to
historical data, starting with the basis of the well-known representation of a
timeline. Because the documents are electronic and interactive, we can use them
to display events and their relationships from different perspectives. The
abstraction mechanism of knowledge representation techniques provide the
reasoning capability necessary for displaying user specified information at a
desired level of detail. In most of this work, time is used as the underlying
structuring dimension. Time is one effective dimension for organizing
information. A number of authors and commercial systems have implemented
electronic timelines of varying complexity, for example,
Yankelovich, et al. [3] , and Plaisant, et al. [4] .
Allen [5] demonstrated highly interactive timelines.
such as graphical timelines linked to text descriptions
and timelines in which items were selected to be be displayed based on attributes.
In addition, Allen proposed that timelines
could be used as information system interfaces.
This work follows and extends that suggestion.
As we will show, traditional timeline
displays are a special case of this mechanism in which the temporal dimension
alone is shown. For instance, we show linking across temporal events.
To illustrate these concepts, we have implemented user interfaces that permit
the specification and visualization of events and their relationships. In the
prototypes, a reader can choose to display subsets of events, reference events,
browse an event hierarchy and rearrange the information space along other
dimensions such as temporal, spatial, causal and subset. The point and click
restructuring capability helps the user prepare better mental model of the
content of a document. Effectively, this is a data viewer for semantically
related events (e.g., [6,7] ).
Document semantics is the information conveyed by the author to the reader. An
author can convey the same information to the reader using more than one
representation. In paper-based document representations, the document semantics
are frozen by the presentation medium. The reader, however, may find one
representation better than another for understanding the meaning conveyed by
the author. The advantage of purely electronic delivery, over other mediums, is
that the reader can manipulate and restructure an electronic document interactively.
One example of differing representations possible in electronic documents can
be found in the context of hypertext and hypermedia. A standard model of
hypertextual documents is graph-based. In this representation, content is
contained in the graph's nodes and links are modeled by intentionally-authored
graph edges [8,9]. A traditional hypertext representation is to
associate the content elements with embedded anchors (i.e., 'hot
spots'). Links, in turn, are associated with the anchors.
One alternative representation that has been investigated is instead to
represent the relationships among content elements spatially. For example,
VIKI [10] allows positioning of elements in two
dimensions with no further explicit representation of anchors or links. Pad
[11] and Pad++ [12] take this a step further representing the
information space in three dimensions. Other systems include models of
different kinds of relationships in addition to that reflected by traditional
hypertextual links. Trellis [13] includes modeling of the temporal
relationships that exist during presentation of document. An electronic,
interactive document allows the reader to select any of the alternative
relationship representations.
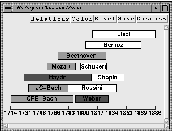
Figure 1. Styles of composers
Figure 2. Composers by coutry, era, and style of music
We adopt an object oriented methodology to define objects, attributes, and
their behavior. Even in a simple case, the number of objects is quite large,
therefore a judicious choice of abstraction granularity is necessary to provide
a balance between the number of objects and the level of document semantics to
be conveyed. For example, Figure 1, taken from a exploration of
musical history, assigns a ``place of origin'' attribute to each music
composer. It is possible to assign a value at a very coarse (country or
continent) or a very fine (house or street) level of granularity. Sometimes the
author may have no choice but to use the coarse granularity, as the value at
finer level of granularity may be unknown.
Figure 2 shows the similarity of music styles between different
classical composers in a timeline format.
A very simple graphical display of objects consists of rectangular shapes
tagged with object identity.
The same data can also be presented in a tabular or textual format. First, the
similarity of style stands out more clearly in the timeline display
[5] . In addition, the graphical representation allows easy association
of ancillary information such as predecessor/contemporary
relationship. Also, in our prototype, clicking on a composer's box displays
more detailed information on him/her. In addition, graphical representation
lends itself to many different kinds of presentation. As an example
Figure 5 uses representative images to show the instruments of the
classical era by category. This is not to say that a graphical display is
always better than tabular display.
For example, when screen space is at a premium, a
compact table may be the best display method.
Each document element may have some attributes of interest to the readers. For
example, a music composer has a particular style, was born in certain country,
belonged to a certain musical era, etc. Two issues of importance related to
attributes are the domain of the attribute values and the number of attributes
to be displayed.
Attribute values can be of two types, namely, qualitative (or categorical) and
quantitative. For example, a music composer can be from classical period
(categorical)
or from the period 1750 AD--1850 AD (quantitative). Attributes
with categorical values can be represented by using color, texture or
shapes. In Figure 1 , three levels of gray are used to represent the
styles of composers. In Figure 2, shape has been used to represent
music style of the composers. Texture can also be used instead of (or in
addition to) shape to obtain the similar effects. In Figure 2, two
additional attributes are shown by spatial placement of elements on the
two-dimensional map. The X-axis represents the country of origin and Y-axis
represents the musical era associated with the composers. 3D display techniques
will allow us to add an additional attribute.
It is harder to represent the attributes in the second, quantitative, category.
These attributes are associated with a numerical value, which is difficult to
represent visually. We have used color gradients and rectangle size to
approximate the value. The efficacy of such approaches however, is not clear.
Representing such attributes accurately almost requires use of a numerical
value tag.
It is possible to classify numerical values manually into range
intervals and to a certain extent this process of classification can be
automated [14] .
Applications of such techniques are numerous, e.g., statistical graphics,
spreadsheets, and visual database query systems.
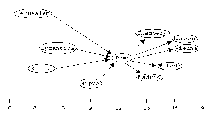
Figure 3. Direction of influence on composers.
It is to be emphasized that a user can switch from one representation of the
document to another easily. The mechanism described above, color, shape,
texture can also be combined together and more attributes can thus be
displayed. It may, however, reduce the clarity and thereby the readability of
the document.
Care must be taken in limiting the number of categories also. Too many
categories will clutter the screen and will limit the comprehensibility of the
document. For example, Figure 1 has only three categories of
style. Figure 2 and 3 have eight and five categories
respectively. Note, it is easy to keep a limited number of shapes and textures
in the database and apply them to the elements on demand.
Relationships among elements are important pieces of a document. Representation
display techniques can be divided into two broad categories: explicit and
implicit.
In the explicit form, lines typically are used to connect the two elements
involved in the relationship. Arrow-headed lines are used for directional
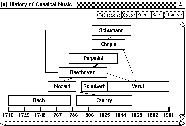
relationships. Figure 3 illustrates the influence on composers of
their predecessors and contemporaries using arrow-headed lines. This form is
most common in paper and electronic documents as in entity-relationship
diagrams [16], object-oriented analysis diagrams [16], and
hypertext and Web structure displays [17].
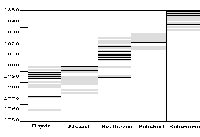
Figure 4. Composers by period and use of musical instruments
The implicit form of representation uses visual cues to emphasize the
relationship. Figure 1 uses two such cues. Shades of gray identify the
related composers and placement of the composer objects on the timeline
determine the direction of influence. Note that Figure 1 provides the
same meaning as Figure 3 .
As another example, Figure 2's X-axis shows a hierarchical
relationship between countries and continents. Figure 4 shows a
similar relationship between instrument and its type.
There are some advantages of using an implicit representation. For example, the
above hierarchical relationship, also known as 'is-part-of' relationship, can
be extended to any depth without loss of readability. In addition, the display
looks less cluttered with the use of the implicit technique.
In this section, we describe several techniques that have been applied in the
presentation of interactive documents. Each technique alters the spatial
presentation of the document. A user can experiment with these techniques on
electronic documents until he/she finds a display that best conveys the
document semantics.
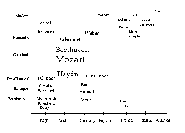
Figure 5. Fisheye view of the document in figure 2, with focus on Mozart
A graphical fisheye view is a distortion-based technique first described by
Furnas [18]. It allows one to focus on a specific area of the screen
while keeping the context visible. Figure 5 shows how fisheye views
can be applied to the document represented in Figure 2. Here the focus is on
Mozart. As we go farther from the point of focus, a progressively reduced view
of other items is shown, displaying significant amounts of context.
A perspective wall [19] allows wide data such as long timelines to be
effectively displayed on the limited screen space. We have
implemented the perspective wall on a 2D display. A user can use forward
and backward buttons to navigate through the document space. The disadvantage
of this techniques is that if the data are equally spread on both X and Y
dimensions, then it is difficult to display the Y dimension.
Figure 6. Birth of musical styles on a log scale.
Many events of interest include long periods in which not much happens
followed by increasing activity.
Logarithms can effectively represent information on these scales by
transforming it a more evenly-spaced linear presentation.
This technique is commonly used for traditional
timelines of geologic or evolutionary history.
Figure 6 shows the birth of various musical styles.
On the time axis each interval represents exponentially larger time periods,
allowing displays of events that happened 10,000 years ago in the perspective
of the events that happened one year ago.
This same idea could be extended to the spatial axis too,
allowing events to be presented
in the nearby zones as well as in remote areas.
In addition, because these are electronic presentations,
the scale could be adjusted interactively by the user.
Figure 7. Overview' of musical centers around the world.
A table of contents [2] allows a user to click on any topic to display
the subsections of that topic by expanding the hierarchy rooted at the topic. A
second click collapses the hierarchy. A useful extension of this approach is a
graphical table of contents [20]. The 'overview' from the Visible
Human project [21] lets users skim through large amount of text or
graphic material while keeping the overview visible and tracking location in the overview.
Overview technique is suitable for showing hierarchical
relationships such as the 'is-part-of' relationship. Figure 7
displays the location and description of musical centers of the word.
Each successive column from right to left, narrows the choice to a smaller area.
By clicking on any element the user can see the hierarchy rooted at that location.
The user can then navigate to any leaf node for details.
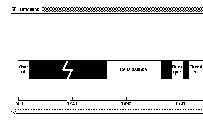
Figure 8. Musical eras.
In the description of log transformations earlier,
the time scales were adjusted to compress periods when there were few events.
An another approach, is simple elision in which users can simply drop out
the uninteresting sections of a graphic.
In a general implementation, the user can
cut out as many sections as desired. Figure 8 shows an example of this
technique. In a pop-up dialog box the user can specify the value at which
elision is to occur. The unit of this value is same as the units of
X-axis. Here, the user has skipped the period between 400 AD and 1200 AD
leaving the rest of the timeline intact.
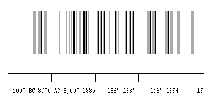
Figure 9. Bar chart of dates of famous musical works by composers.
This age-old technique is effective both on interactive documents and on static
documents. Figure 9 shows dates of major pieces of music by composer.
Clicking on a work displays more details in a popup window. This is useful for
displaying objects that have numerical attribute values. Bars also can be
color/texture coded to show additional attributes.
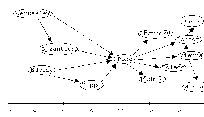
Figure 10. Direction of influence of music: Relationship with the focus on Rome.
Figure 11. Direction of influence of music: Extended relationship in the context of Rome.
Limited 'discovery' of causality can be illustrated using simple transitive
inference mechanisms. An example of this is shown in Figure 10 . Here
the user wants to see all the elements that are directly related in some way to
the city Rome. This is clearly a small set of all relationships that exist
in the document. By double clicking on the node labeled Rome, the user can also
see the extended relationships in which Rome is involved, this provides
contextual information to the reader as shown in Figure 11 .
Similarly, we could seek to discover information about our composer's
teacher-student lineage and perhaps even investigate in the potential
for chance meeting among composers, as reflected in overlapping
lifespans and work locations.
The prototypes described in this paper for displaying objects, attributes and
their relationship were implemented in Tcl version 7.4 and TK version 4.0
[22] under Solaris. Some techniques for interactive manipulation of
documents were implemented in the Java language [23], also on the
Solaris platform. The prototypes remain under development.
Electronic document representation enables presentations that borrow familiar
forms from the past coupled with unprecedented flexibility. The interactive
document metaphor, combined with a graphical user interface, permits the reader
to tailor information presentation to enhance understanding. We have
presented an object-oriented methodology for implementing abstractions and
reasoning mechanisms that enables use of innovative presentation techniques in
mapping abstractions onto displays.
In this paper we focused on presentation issues involved in pure electronic
delivery of documents. Document specification systems such as ODA [24]
and SGML combined with DSSSL [25,26] provide a strong logical
structure for printed documents, which is separated to a degree from their
physical appearance. Our system extends this work to electronic documents by
allowing one to alter the visual or graphical presentation of the document
without affecting its logical structure---in other words, the presentation can
be tuned to its desired application without altering the 'database.'
The approaches described here also provide implementation of some kinds of
general interfaces for information systems. A number of specific approaches
using an interactive document metaphor have appeared in the recent literature
[2,4,27]. Our approach generalizes the specific approaches by
providing a domain-independent abstraction mechanism. This abstraction
mechanism underlies our prototypes that implement interaction methods such as
fisheye views [18] and the perspective wall [19].
While time provides a strong underlying dimension, it does not solve
the problem of selection and structuring information as a coherent whole.
There are many open and difficult challenges ranging from effective
foramtting to generation of descriptions of the events presented.
Nevertheless, timelines can be effective and novel organizers
for digital libraries of historical information.
The profiles of music composers as illustrated in this paper were obtained from Harman [28] . This material is based in part on work supported by the Texas Advanced Research
Program under Grant Numbers 999903-155 and 999903-230.
1. R.Furuta, 'Concept and models for structured documents', in Structured
Documents, eds., J.Andre, R.Furuta, and V.Quint, 7--38, Cambridge
University Press, (1989).
2. R.B. Allen, 'Interface issues for interactive multimedia documents', in
Forum on Research and Technology Advances in Digital Libraries, ed., N.
Adam, et al., Springer-Verlag, (1995).
Also Proceedings Digital Library Forum, May 1995, McLean, VA, pages
133-141.
3. N.Yankelovich, B.J. Haan, N.K. Meyrowitz, and S.M. Drucker, 'Intermedia:
The concept and the construction of a seamless information environment',
Computer, 21(1), 81--96, (January 1988).
4. C.Plaisant, B.Milash, A.Rose, S.Widoff, and B.Shneiderman, 'Lifelines:
Visualizing personal histories', in Proc. ACM CHI'96, (April 1996).
5. R.B. Allen, 'Interactive timelines as information systems interfaces', in
Symposium on Digital Libraries, 175--180, (August 1995).
6. D.Swayne, D.Cook, and A.Buja, 'Interactive dynamic graphics in the X
window system with a link to S', in Proceedings of the Section on
Statistical Graphics of the American Statistical Association, 1--8, (1991).
7. M.E. Lesk, 'What to do when there's too much information?', pp. 305--318. ACM
Hypertext, (November 1989).
8. R.Furuta, 'Documents in the digital library', in Proc. Digital Libraries
'95, (1995).
9. O.Picher, E.Berk, J.Devlin, and K.Pugh, 'Hypermedia', in
Hypertext/Hypermedia Handbook, eds., Berk and Devlin, McGraw Hill, (1991).
10. C.C. Marshall, F.M. Shipman, and J.H. Coombs, 'VIKI: Spatial hypertext
supporting emergent structure', in Proceedings European Conference on
Hypermedia Technologies (ECHT'94), 13--23, (1994).
11. K.Perlin and D.Fox, 'Pad: An alternative approach to the computer interface',
in Computer Graphics Proceedings, Annual Conference Series, 57--64,
(1993).
12. B.Bederson and J.Hollan, 'Pad++', in Proc. ACM UIST: User Interface
Software and Technology, 17--26, (November 1994).
13. P.D. Stotts and R.Furuta, 'Petri-net based hypertext: Document structure with
browsing semantics', ACM Transactions on Information Systems, 7,
3--29, (1989).
14. E.Tufte, The Visual Display of Quantitative Information, Graphics Press,
Cheshire, CT, 1983.
15. E.F. Codd, The Relational Model for Database Management: Version 2,
Addison-Wesley, Reading, MA, 1990.
16. J.Martin and J.J. Odell, Object Oriented Methods: A Foundation,
Prentice Hall, Englewood Cliffs, New Jersey, 1995.
17. T.A. Keahey and R.Rivenburgh.
HyperLINK: Visualization of WWW navigation, 1996.
HyperText'96 demonstration,
http://www.c3.lanl.gov/keahey/navigate.html.
18. G.W. Furnas, 'Generalized fisheye views', in Proc. ACM SIGCHI, pp.
16--23, (1986).
19. J.D. Mackinlay, G.G. Robertson, and S.K. Card, 'The perspective wall: Detail
and context smoothly integrated', in Proc. ACM CHI'91, pp. 173--179,
(1991).
20. X.Lin, 'Graphical table of contents', in Proc. ACM Conference Digital
Libraries, 45--53, (1996).
21. C.North, B.Shneiderman, and C.Plaisant, 'User controlled overviews of an
image library: A case study of the visible human', in Proc. ACM
Conference Digital Libraries, 74--82, (1996).
22. J.Ousterhout, Tcl and TK Toolit , Addison-Wesley, 1994.
23. SunMicrosystems Inc.
The Java language environment: A white paper.
http://www.javasoft.com/whitePaper/java-whitepaper-1.html.
24. International Standard Organization.
Text and office system---office document architecture (oda) and
interchange format, 1989.
International Standard 8613.
25. International Standards Organization.
Text and office systems-standard generalized markup language, October
1986.
Document Number: ISO 8879-1986(E).
26. International Standard Organisation, Final Text, ISO/IEC CD 10179,
Information Technology---Text and Office Systems---Document Style Semantics
and Specification Language (DSSSL), 1991.
ISO/IEC Draft International Standard 10179.
27. R.B. Allen, 'Two digital library interfaces which exploit hierarchical
structure', in Proceedings of Electronic Publishing and the Information
Superhighway, 134--141, (May 1995).
28. C.Harman, A Popular History of Music, Dell Publishing Co., New York, NY,
1969.
1 INTRODUCTION
2 PRESENTATION
Interactive documents also allow manipulation of their presentation (i.e.,
changes to the display that are independent of the document's semantic
structure). Abstractions can be mapped to the screen display using one of the
several available display representations. As illustrative examples we
examine variations of the following techniques:
non-linear representation of timelines;
distortion-based techniques to integrate detail and context; and
the use of lines and texture to display related objects.
end itemize
Examples of these, taken from our prototype presentations, are given later in
this paper.
3 GENERATING PRESENTATIONS AND DOCUMENT SEMANTICS
3.1 Granularity of abstraction
4 PRESENTATION ISSUES
4.1 Displaying objects
4.2 Displaying attributes
4.2.1 Domain of attribute values
4.2.2 Number of attributes
4.3 Displaying relationships
4.3.1 Explicit representation
4.3.2 Implicit representation
5 VIEWS AND INTERFACES FOR MANIPULATING DOCUMENTS
5.1 Graphical fisheye views
5.2 Perspective Wall
5.3 Log transforms
5.4 TOCs and Overviews
5.5 Elision
5.6 Bar charts
6 SIMPLE INFERENCES BASED ON DATA RELATIONSHIPS
7 IMPLEMENTATION DETAILS
8 DISCUSSION AND CONCLUSION
ACKNOWLEDGEMENTS
REFERENCES
